Databases give you names. AllocatorBase shows you what to do with them.
125,000+ contacts across 35,000+ SEC-verified firms with probability scoring, mandate alignment, and deployment signals — installed directly into your CRM. Built for alternative asset managers raising $100M–$5B.
Integrates with HubSpot & Salesforce · No placement fees · Founding pricing available
Built on the process that raised $6.1 billion
A scored, prioritized pipeline — not a contact list.
This is what AllocatorBase looks like inside your CRM. Every allocator scored on three dimensions. Your team opens HubSpot or Salesforce and knows exactly who to call first.
AllocatorBase · Pipeline View
| Allocator | AUM | Type | Prob | Eng | Fit |
|---|---|---|---|---|---|
Meridian Endowment Fund Endowment · 94% | $2.4B | Endowment | 92 | 81 | 95 |
Northbridge Advisors Consultant · 88% | $1.8B | Consultant | 88 | 56 | 90 |
Pacific Family Office Family Office · 91% | $890M | Family Office | 85 | 79 | 82 |
Cornerstone Pension Public Pension · 86% | $3.1B | Pension | 78 | 28 | 84 |
Summit Capital HNW Wealth Manager · 72% | $420M | Wealth Mgr | 38 | 87 | 41 |
We kept buying databases and asking "now what?"
We've been customers of Dakota, AdvizorPro, and other platforms. The data was useful. But every import created duplicates, CRMs aren't designed for fundraising, and our team never knew who to call first. AllocatorBase is the infrastructure layer we built to solve that — and then productized for every alternative asset manager facing the same problem.
Probability, Engagement, and Fit — scored independently at both the firm and contact level. When scores diverge, they tell your team exactly what to do next.
AUM from ADV Item 5. Client composition from Item 5D. Contacts from IAPD. Not "AI-enriched." Not scraped. SEC-verified and auditable.
Every firm is algorithmically classified — Endowment, Family Office, Pension, OCIO — with a confidence score derived from Form ADV data.
A structured boolean derived from Form ADV that answers the question every fundraiser asks first: is this firm currently investing in alternatives?
From database to working pipeline in days, not months.
Start with scored allocator intelligence. Add CRM infrastructure when you're ready to go deeper.
Filter 125,000+ firms by mandate alignment, AUM, strategy, and deployment probability. Build a target universe of the 50–200 allocators that actually fit your fund.
Scored allocator lists flow directly into HubSpot or Salesforce with deal stages, lifecycle properties, and segmentation already configured. No CSV imports. No manual data entry.
AI-assisted sequences, engagement scoring, and nurture campaigns execute inside your CRM. Your team starts working the pipeline immediately — not building infrastructure.
Pipeline analytics show where every allocator sits — from identified to engaged to active evaluation to commitment. Measure what's working and where deals stall.
Same data hunt, different outcome.
Most databases give you contacts. AllocatorBase gives you a scored, segmented pipeline ready to work.
| Capability | AllocatorBase | Dakota | FINTRX | AdvizorPro | Altss | RIA Database |
|---|---|---|---|---|---|---|
| Allocator profiles | ✓ 125,000+ | ✓ | ✓ | ✓ | ✓ | ✓ |
| Probability scoring (0–100) | ✓ | — | — | — | — | — |
| Pipeline staging in CRM | ✓ | — | — | — | — | — |
| Deployment timing signals | ✓ | — | — | — | ✓ | — |
| CRM-native integration | ✓ | ✓ | One-way | ✓ | — | — |
| SEC ADV-sourced | ✓ | Partial | Partial | Partial | OSINT | Partial |
| Starting price | $750/mo | ~$16,500/yr | Not published | Not published | $15,500/yr | Not published |
Transparent. No seat-based lock-in.
Full database access with scoring, mandate filtering, and CRM integration.
Pipeline diagnostic. Find where capital leaks before you build.
CRM architecture, scoring workflows, and pipeline analytics installed.
Latest on capital formation
View all articles →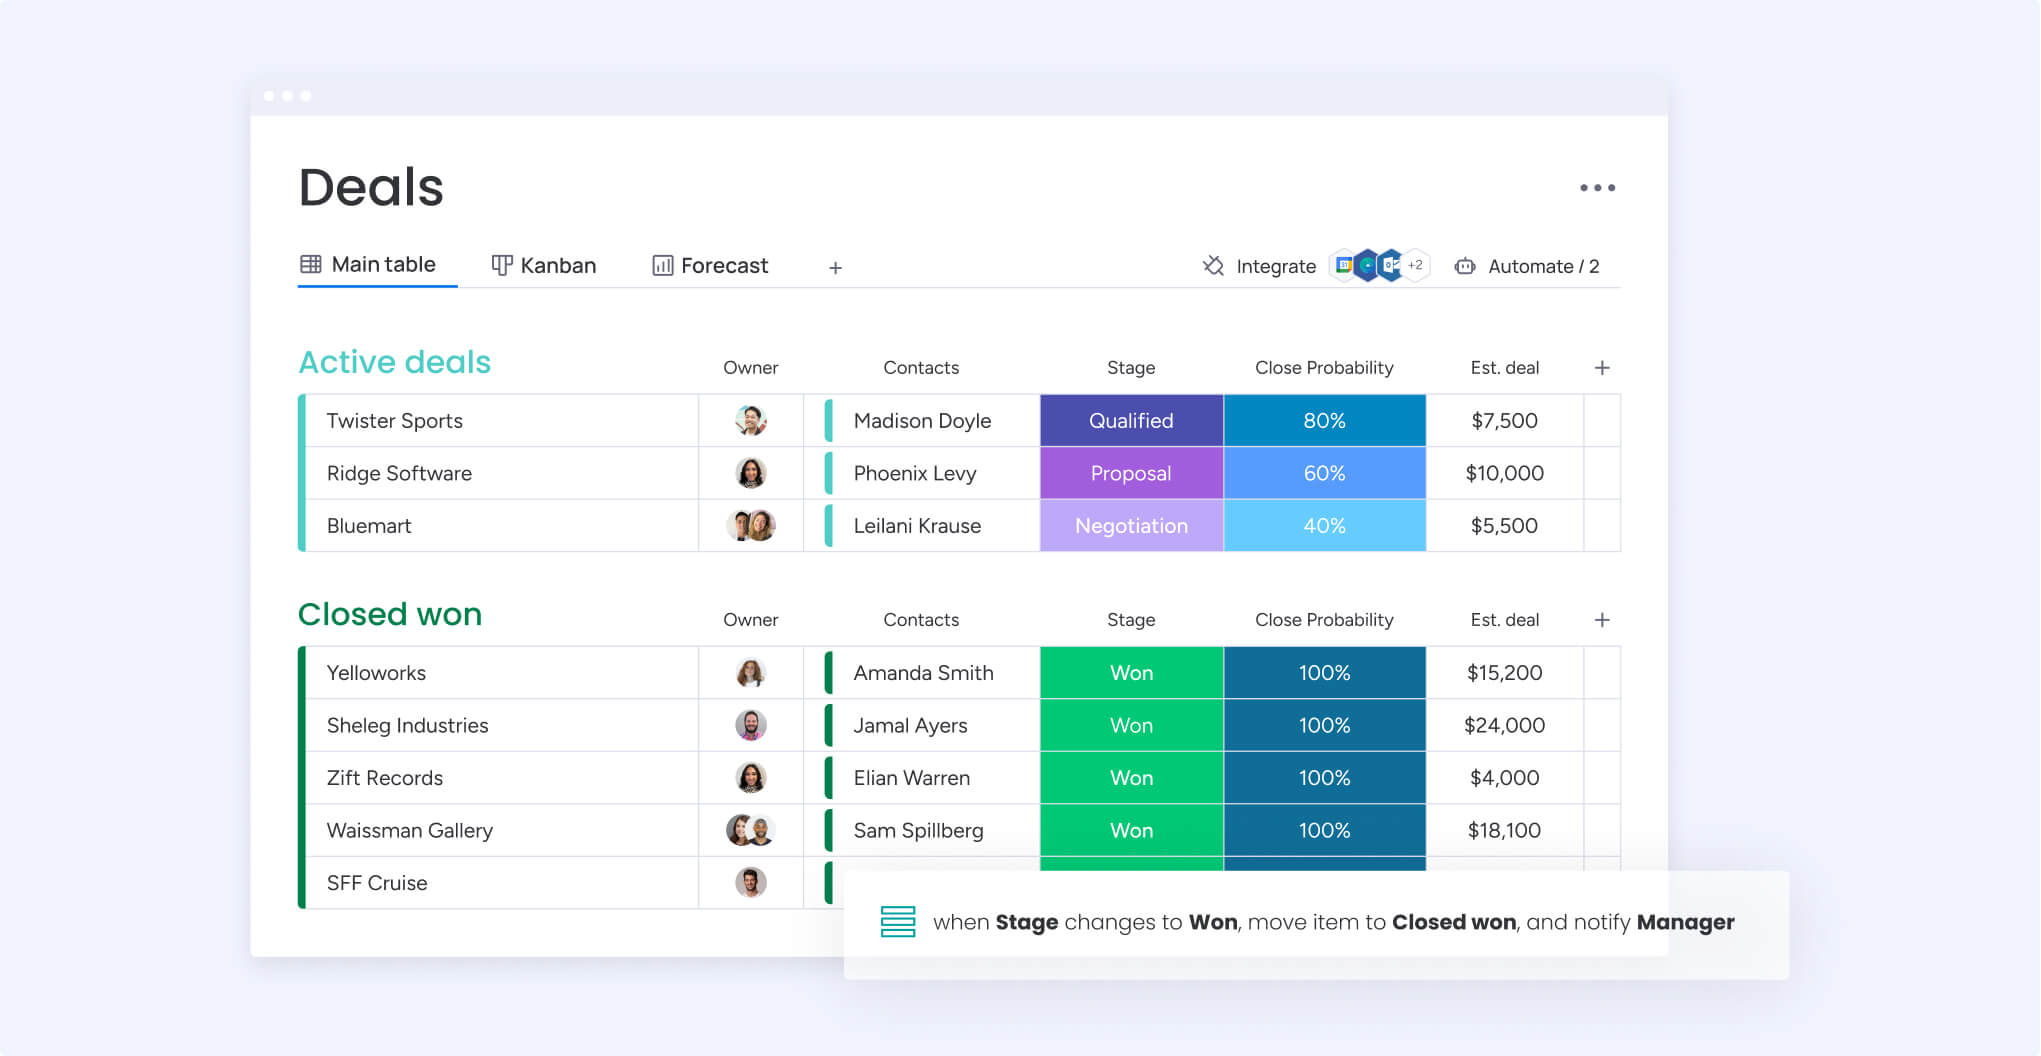


See the allocators most likely to deploy into your fund.
Book a 15-minute demo. We'll show you live probability scores for allocators that match your strategy.
No obligation · No placement fees · Founding pricing available